matplotlibのsubplotを使った図の作成
matplotlibの使い方、subplot関数の使い方についてまとめました
基本準備
Irisのデータを使う
import numpy as np
import pandas as pd
import matplotlib.pyplot as plt

df = sns.load_dataset("iris")
通常のグラフ作成
軸の範囲・表示値設定
- xlim:x軸の値範囲
- ylim:y軸の値範囲
- xticks:表示するメモリの値
軸のテキスト設定
- xlabel:x軸のラベル設定
- ylabel:y軸のラベル設定
- title:グラフのタイトル設定
plt.plot(df.sepal_width, df.sepal_length, '.', label="test")
plt.xlim(2.0,5.0)
plt.xticks([2,3,4, 5]) #メモリの設定
plt.yticks([4,5,6,7, 8])

plt.xlabel('sepal_width')# x軸のラベル設定
plt.ylabel('sepal_length')
plt.title('test',fontsize=20)

plt.legend(loc='best')# 一番いい感じのところで設定してくれる

重ねてグラフ表示
まずは普通に表示する
plt.plot(df.sepal_width, df.sepal_length,'.',color='red')
plt.plot(df.sepal_width, df.petal_length,'x',color='blue')

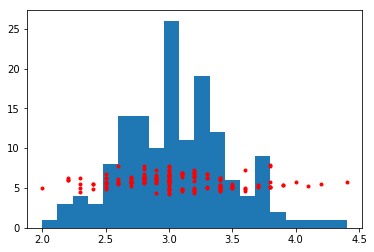
だけど、違う種類同士のグラフだとy軸が重なり合って、良く分からない感じの図になる。
plt.hist(df.sepal_width , bins=20)
plt.plot(df.sepal_width, df.sepal_length,'.',color='red')

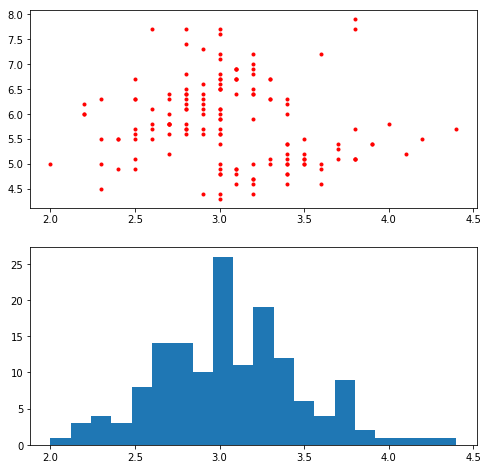
解決策その1:別々のグラフにして表示する
まずfigureのインスタンスと言う箱的なのを作る。
その後、箱の中をサブプロットと言う関数で分けて、別々のグラフをその中で表示させる。

fig = plt.figure(figsize=(8,8))

ax1 = fig.add_subplot(211)
ax2 = fig.add_subplot((212), sharex=ax1)#y軸の共有

ax1.plot(df.sepal_width, df.sepal_length,'.',color='red')
ax2.hist(df.sepal_width , bins=20)

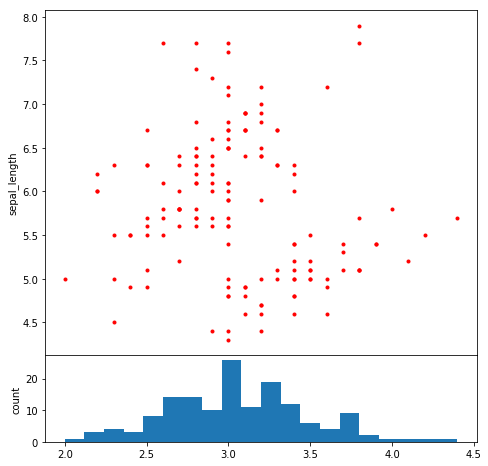
解決策その2:グラフを上下に表示させる
ザックリとやってることをいかにまとめた。

fig = plt.figure(figsize=(6,6))

# サブプロットを8:2で分割
ax1 = fig.add_axes((0, 0.2, 1, 0.8))#[left(左端からの距離), bottom(下からの距離), width(幅), height(高さ)]
ax2 = fig.add_axes((0, 0, 1, 0.2), sharex=ax1)

# 散布図のx軸のラベルとヒストグラムのy軸のラベルを非表示
ax1.tick_params(labelbottom="off")

#ラベル設定
ax1.set_ylabel('sepal_length')
ax2.set_ylabel('count')

ax1.plot(df.sepal_width, df.sepal_length,'.',color='red')
ax2.hist(df.sepal_width , bins=20)

参考資料
http://bicycle1885.hatenablog.com/entry/2014/02/14/023734
解決策その3:左右のy軸で別々の値を表示させる
Figureのインスタンスを生成し、Axesのインスタンスの中でx軸を共有させてグラフを作るといい感じに作れる。(twinx()関数)
詳しくは後でまとめるので、一旦コードだけ。
fig = plt.figure(figsize=(6,6))

# サブプロットを作成・x軸の共有
ax1 = fig.add_subplot(111)
ax2 = ax1.twinx()

#ラベル設定
ax1.set_xlabel('sepal_width')
ax1.set_ylabel('sepal_length')
ax2.set_ylabel('count')

ax1.plot(df.sepal_width, df.sepal_length,'.',color='red')
ax2.hist(df.sepal_width , bins=20,alpha=0.4)

補足
- legendについて
legendを表示させる場合は、普通にやると上手くいかない。
なので、以下のようにして一つにまとめてやる必要がある。
handler1, label1 = ax1.get_legend_handles_labels()
handler2, label2 = ax2.get_legend_handles_labels()
ax1.legend(handler1 + handler2, label1 + label2, loc='best',fontsize=14)
- axesでのx軸目盛について
こちらも普通にax1.xtickとかやっても上手くいかない。
ax1.set_xticklabels([~~], rotation = 90)とかで処理できる